Astronomical Research
There is more information available within WorldWide Telescope that a newcomer can easily grasp, and there are terabytes of astronomical information available on the Internet. This section describes the features and data within WorldWide Telescope that experienced astronomers should find helpful in their studies.
Creating New Collections🔗
A collection is the term used to describe a WorldWide Telescope data file. You can create your own collections, either from existing images or perhaps from your own data. As long as the data that the new collection references is available on the internet, your new collections can be shared.
To create a new collection, either select Explore > New > Collection... , or select Collections > My Collections > Add New Item , which has the same effect. Enter an appropriate name in the Create New Collection dialog box. Your new collection will be added under My Collections and the data will be saved off automatically when you add new images to it.
To add images to this new collection use the Research option of the Finder Scope, which has an Add to Collection menu entry. If you select the Add New Item thumbnail when the new collection is displayed in the top panel this will add a new folder to your collection, enabling a folder and image structure which might be helpful for a large or complex collection. Add as many folders and images as you like to the collection.
To edit the metadata for any one of the images, right click the thumbnail for the image, and select Edit . This will bring up the Edit Object Information dialog:
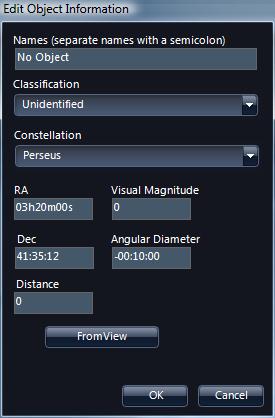
Some of the metadata information is populated, including the Constellation and RA and Dec co-ordinates, when the image is added to the collection. Clicking FromView will overwrite this with the co-ordinates of the current view, so be careful of clicking this inadvertently.
Add appropriate Names and Classification .
Your own collections are saved to the My Documents/WWT Collections folder. Each time you add an image to a collection the file is updated. If a collection is moved to another location, you can open if by browsing to it using the Explore > Open menu option.
Note that by right-clicking on an image in one of your collections, the Remove from Collection menu option is available for you to delete images. To delete or rename a collection, right-click the collection thumbnail. To move images around within a collection that contains folders, use the Add to Collection option to add the image to the right folder, then Remove from Collection to delete the image in the wrong folder.
To share your collection with other users, email the .wtml file in the My Documents/WWT Collections folder. The users that receive this email can either double click on the wtml file (if the file mime types have been set up appropriately) to open up WorldWide Telescope with this collection, or simply use Explore > Open to navigate to and open the collection.
Comparing Foreground and Background Images🔗
Astronomers often use comparisons of images of different wavelengths of an object to help expose information about that object, such as the type of gasses being emitted, the blue or red-shift, the intensity of x-rays or gamma rays, and so on.
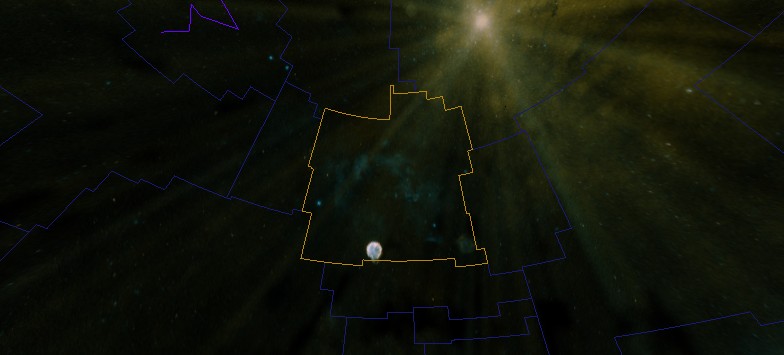
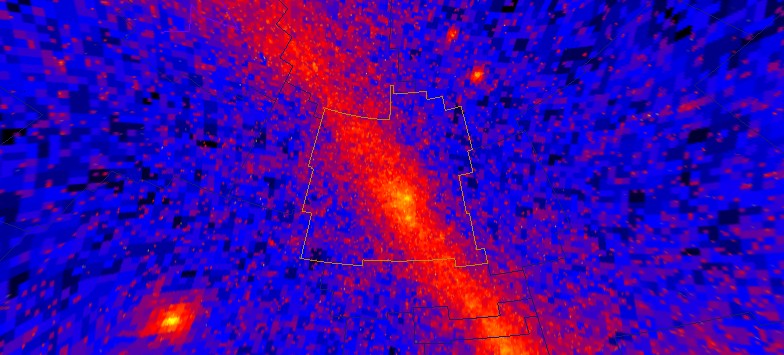
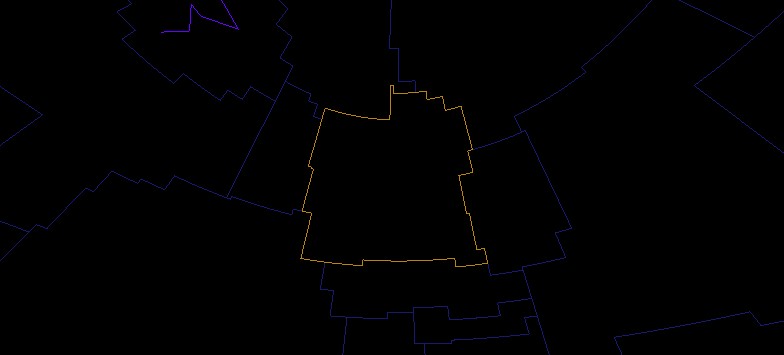
WorldWide Telescope has the concept of a study - usually a single or composite image of one object in space, and a survey - usually a comprehensive collection of data from a large area of the sky. Typically a study is loaded from a Collection by clicking a thumbnail in the top panel, and a survey is selected from the Imagery list. In this context the study is the foreground image and the survey the background image. There are options to reverse this, or to compare two studies or two surveys, but the study on top of the survey is the default operation.
When both a foreground and background image are in view, the Image Crossfade slider appears, enabling you to visually compare the two images:

Another method of comparing images is available if there are several
thumbnails (studies) of the same object. For example, select Explore >
Collections > Chandra Studies
and then scroll to Kepler's Supernova
.
There are a number of thumbnails representing different studies of this
feature, including the visible wavelength and high energy x-rays. To compare
the studies without any change in camera position, click on the picture icons
in the top right hand corner of the thumbnails: 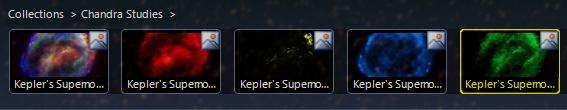
 The picture icon.
To change the default operation of a study as foreground and survey as background there are a number of options. All default surveys appear as thumbnails in the Collections > All-Sky Surveys folder. Simply clicking on the thumbnail will load the survey as background. However if you right-click on the picture icon, there is the option to load the survey as foreground or background. Load one as foreground and one as background and the Image Crossfade slider will be enabled to compare the two. Similarly two studies can be compared this way.
There are options in the Finder Scope to set images as foreground or background, and then there is the greater flexibility (and complexity) provided by the SDK (refer to the WorldWide Telescope Data Files Reference document).
Note that not all images of an object are taken from exactly the same camera position. Also sky survey images are composite images -- perhaps with images taken at different times or even by different telescopes -- so the exact location of an object may appear to vary.
The Finder Scope🔗
The Finder Scope is a pane designed to help you fix on and research a particular object. It can be opened by right-clicking on the view, or from the Explore menu.
Certain celestial objects, when pointed to, display a circle and a name. This indicates that the object is in one of the databases that WorldWide Telescope links to. Right-click the object to display the Finder Scope. With the Finder Scope , you can refine your search in the field of view, or research your selected object from online references.
You can also view the object's image from the DSS or SDSS archive, download its DSS FITS file, or run a USNO NVO cone search for objects near the selected object.
If you find an object you wish to research further, try not to move the Finder Scope as the RA and Dec will change, so if you then click Research for example, this will use the new values and not those of the object.
Note also that you can pan by dragging the Finder Scope to the edges of the field of view.
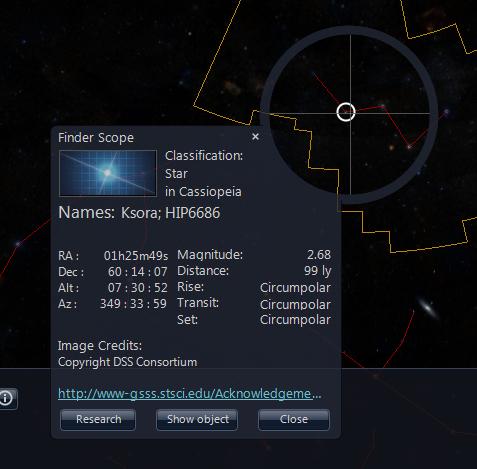
An object in space may have multiple names: Ksora and HIP6686 in the example shown.
Click Show object to return to the view of the object if for any reason the view no longer shows it.
The properties of the object (RA, Dec, Alt and so on), are explained in the Astronomy Terminology tutorial.
Refer also to the note: Viewing from a new location.
Both the X in the top right corner, and the Close button, close the Finder Scope .
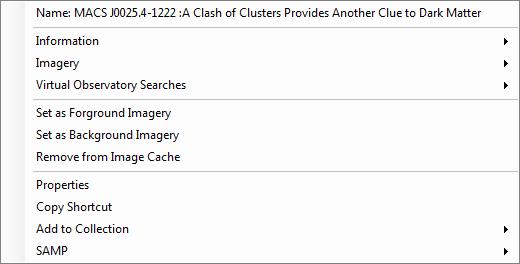
Click Research to bring up a menu of options to research websites for data or more images of the object.
The Set as Foreground Imagery , Set as Background Imagery , and Remove from Image Cache will only appear in the menu if these items are relevant to the selection.
Copy Shortcut can be used to create and copy a URL locating the object that can be emailed to friends or colleagues. Refer to the Sharing Views section of the WorldWide Telescope Data Files Reference for specific details of the format of the URL.
Add to Collection can be used to store the view in a data collection file you are working on.
- SAMP is an astronomy protocol for sharing data.
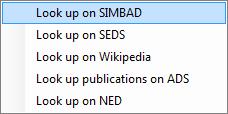
- SIMBAD: the Set of Identifications, Measurements, and Bibliography for Astronomical Data.
- SEDS: the Students for the Exploration and Development of Space.
- Wikipedia: online encyclopedia.
- ADS: the Smithsonian/NASA Astrophysics Data System.
- NED: the NASA/IPAC Extragalactic Database.
- DSS: Digitized Sky Survey
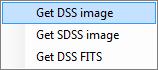
- SDSS: Sloan Digitized Sky Survey
- FITS: Flexible Image Transport System image, commonly used in astronomy because of its ability to store human-readable metadata.
- Virtual Observatory Searches
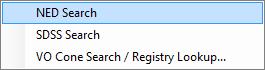 Refer to the Virtual Observatory Tables example below.
 - SAMP options
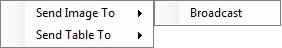 Send the image or table data to Broadcast to be picked up by all other
SAMP compliant
programs you are running.
Send the image or table data to Broadcast to be picked up by all other
SAMP compliant
programs you are running.
Virtual Observatory Tables🔗
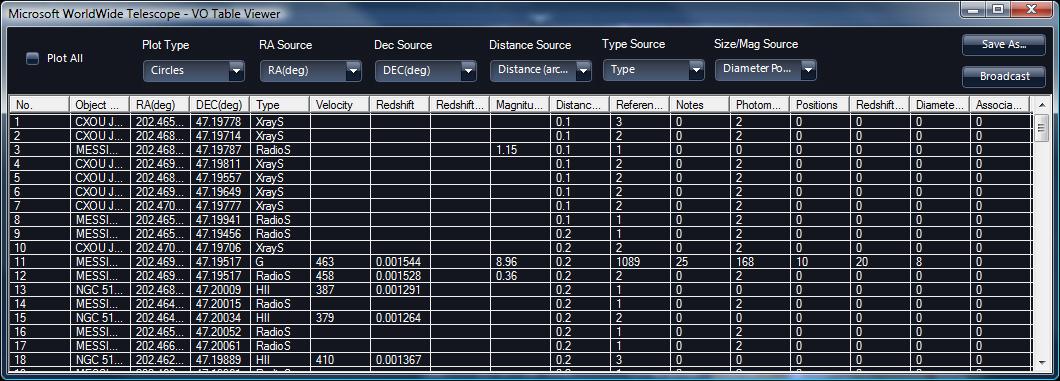
Virtual Observatory (VO) Tables are a standard exchange format for astronomical catalog data and queries to registries allow you to find, plot and interact with a wide variety of catalogs that have VO table interfaces.
VO Queries from the Finder Scope🔗
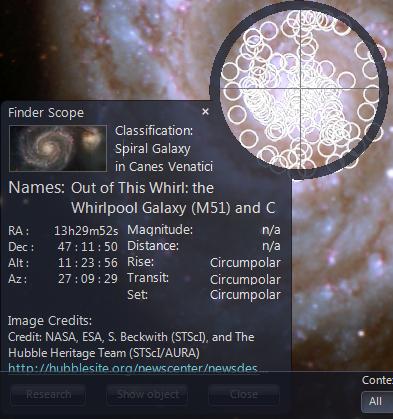
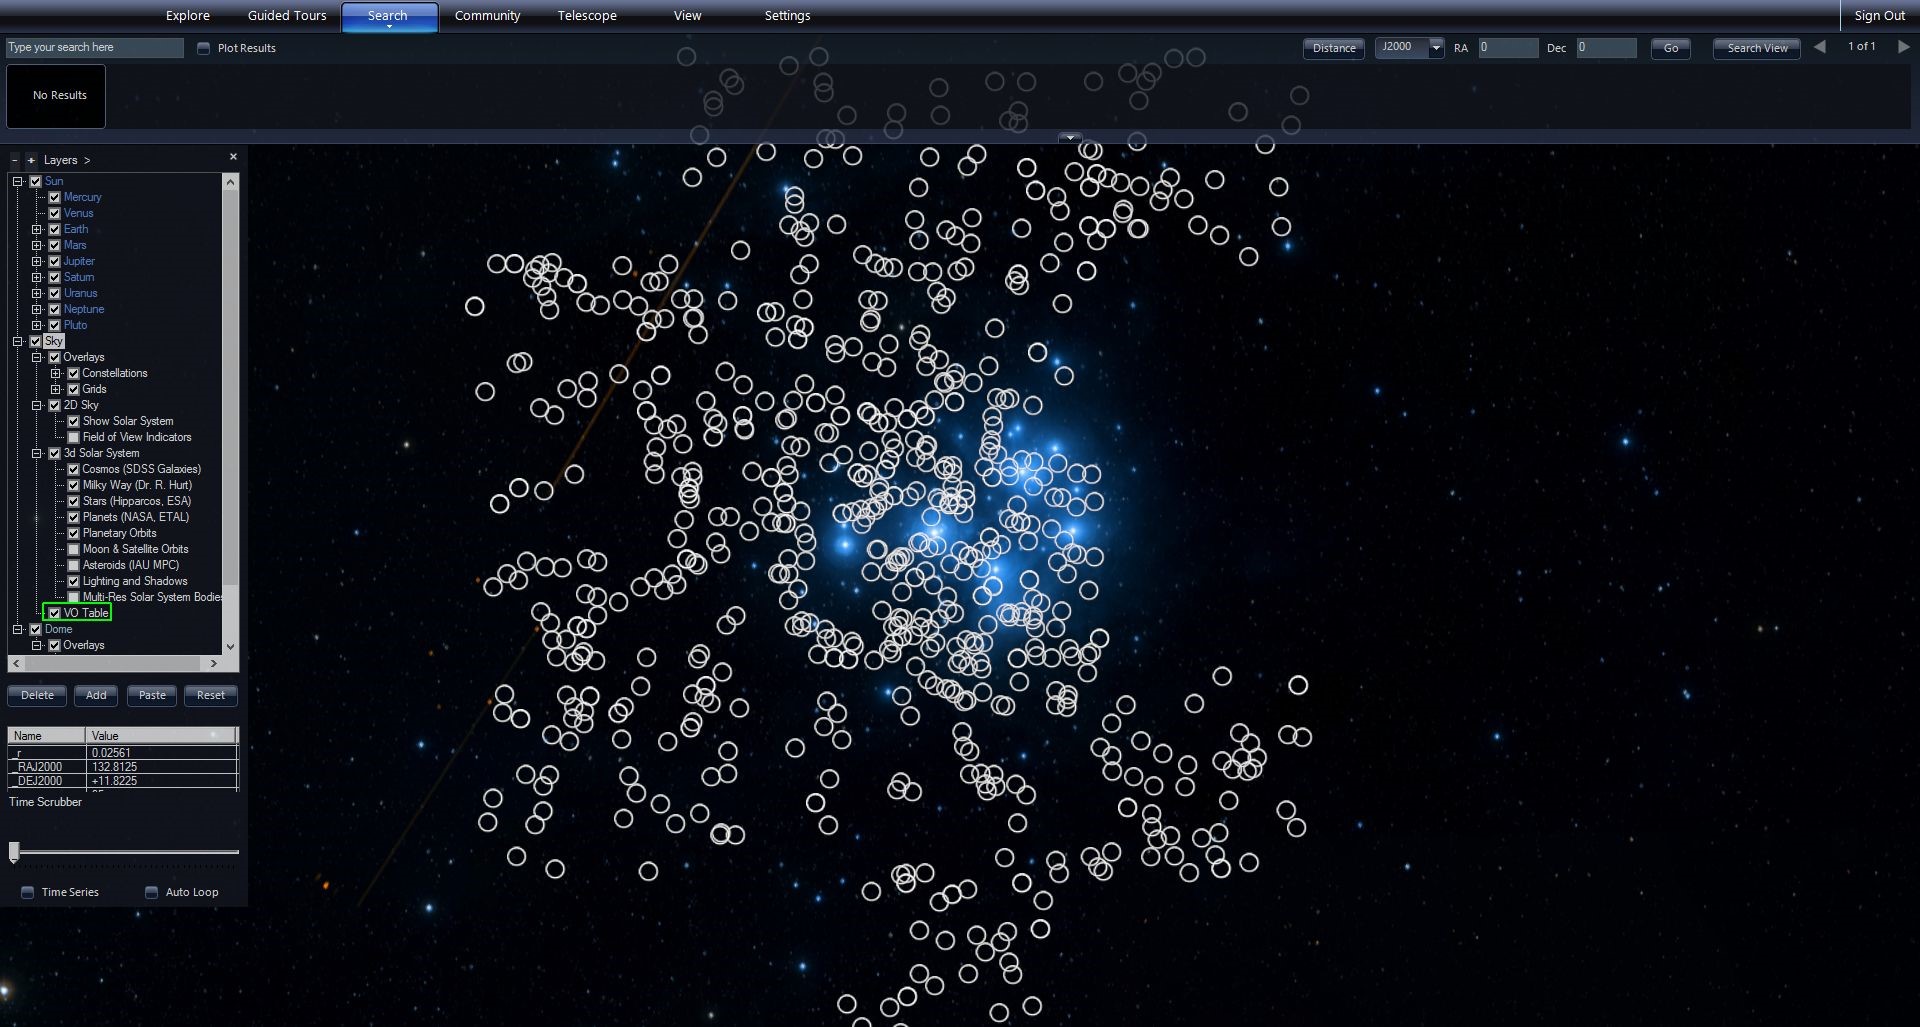
You can launch VO queries of the current view using the Finder Scope. For example, use the Search Panel to navigate to the galaxy M51 — much better known as the Whirlpool Galaxy, and right click to bring up the Finder Scope . Selecting Research > Virtual Observatory Searches > NED will bring up the VO table shown below. Select Plot All in the VO Table Viewer to annotate all the located objects in the view with the selected Plot Type (white circles by default) — a lot in the case of M51! Now use the Finder Scope on the individual plots to investigate them further, many will be unidentified electromagnetic wave sources.

VO Cone Searches🔗
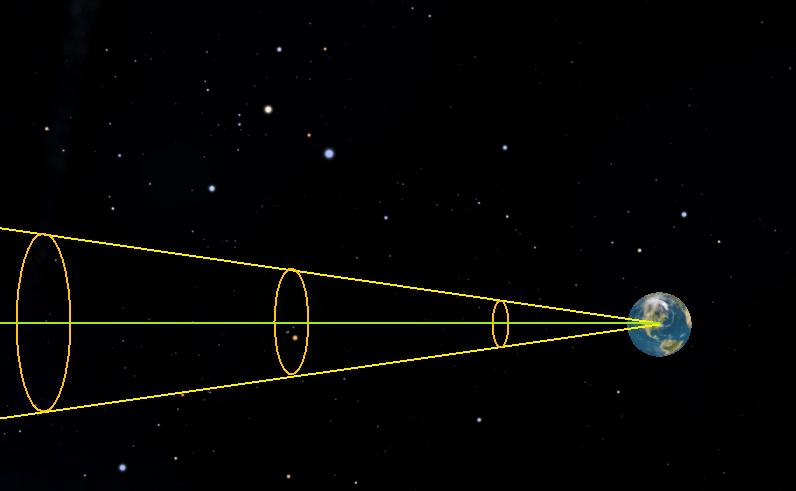
A Virtual Observatory (VO) cone search is a search for data on objects in space within a cone - specified by a direction into space and a radius. The diagram below shows a cone search with a radius of approximately 8.5 degrees.
The cone search can be refined by specifying that only certain types of objects ("white dwarfs", "knots", "supernovae" etc.) should be located.
WWT’s View menu allows you to perform cone searches with greater control than that offered by the Finder Scope. First, orient the view to a sky location of interest. In this example we target the Pleiades open cluster.
- Make sure you are in Sky mode.
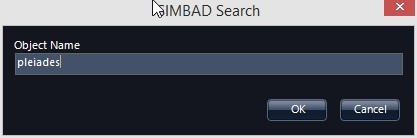
- Under the Search Tab, select SIMBAD Search … .
- Enter “Pleiades” in the search box. This will orient your view to the
Pleiades cluster and zoom in.
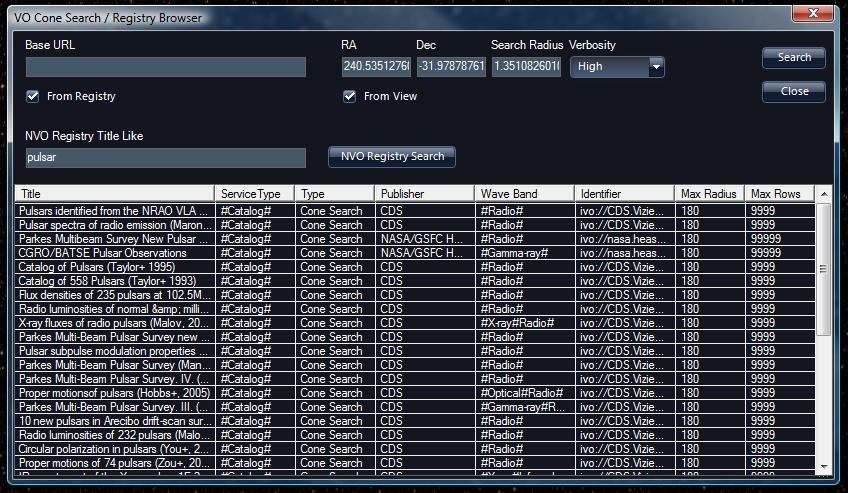
- Under the Search Tab, open the VO Cone Search / Registry Lookup … .
- In the field “NVO Registry Title Like” enter “Pleiades.” Then click the “NVO Registry Search” button.
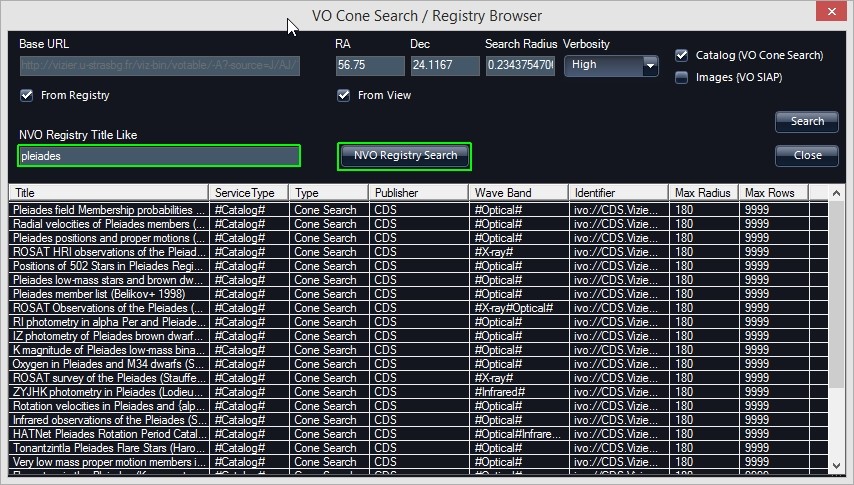
- This will populate the bottom of the table with a list of VO “registries”, which in this case are catalogs registered with the VO service.
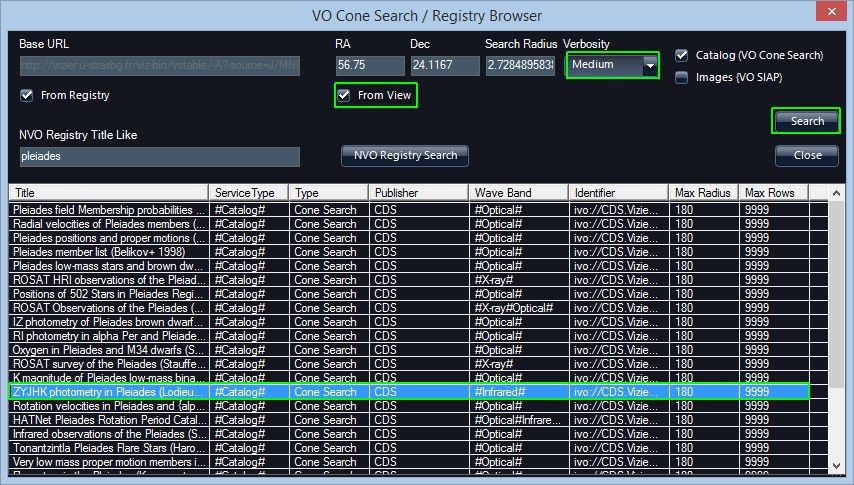
- Click on a row to search that catalog. This will load values into “Base
URL.” For this example, select “ZYJHK photometry in Pleiades …” Since you
are looking at the location of the Pleiades, you can click the checkbox
next to “from View.” Set the Verbosity pull-down to “Medium” in order to
return photometric measurements at all observed bands, rather than the
default positions if the default “Low” is used. Then click “Search” on the
right.
- This will plot the catalog entries of the returned table on the background
sky image. The default is to plot circles at each location. Also, this
table is added as a layer (default name is “VO Table”) under the “Sky” of
the Layer Manager on the left. If you close this table, you can always
right-click on the “VO Table” in the layer manager and select “VO Table
Viewer.”
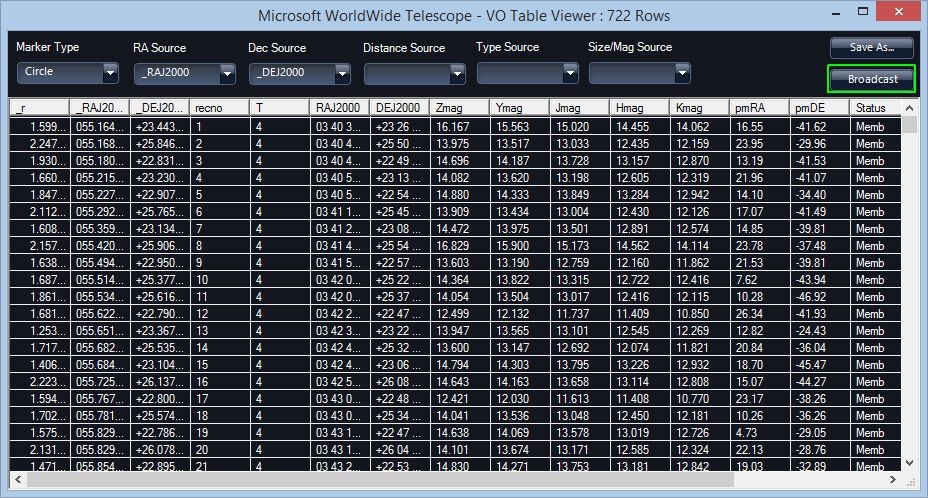
- Clicking on an entry of the returned table will center the display on the location of the catalog entry and show a label.
- You can right-click on the VO Table layer in the layer manager and select Copy and then you can paste the table into an Excel spreadsheet.
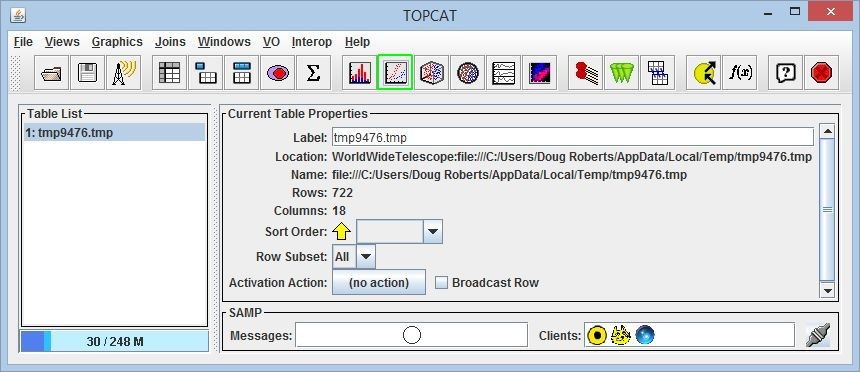
- To plot data, you can use software like TOPCAT. First download and run TOPCAT according to its installation instructions. Then in the VO Table Viewer click the “Broadcast” button. This uses the SAMP messaging protocol to send the retrieved VO Table to TOPCAT for plotting.
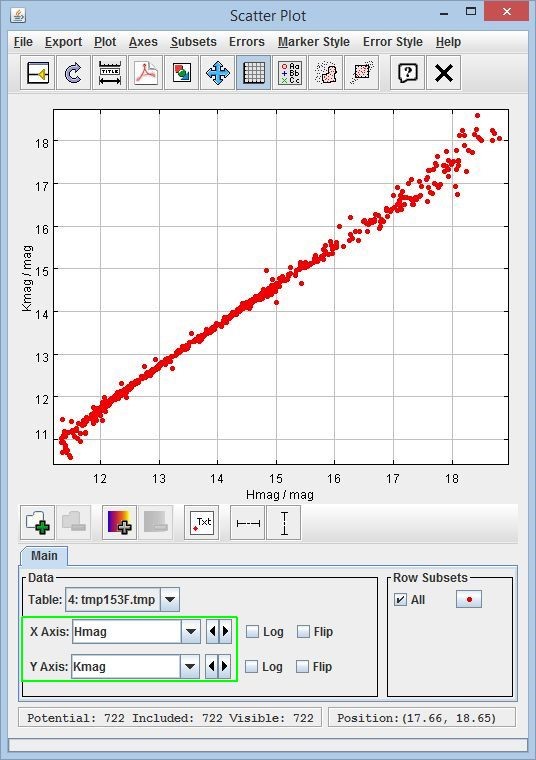
- In TOPCAT, you can then set up a scatter plot, by clicking the icon
at the top menu.
- This brings up a scatter plot window. You can map columns to axes in the
plotting window.
- You can also save the current table out of TOPCAT as Comma Separated Variable (CSV) format for input into Excel or other software.
FITS Images🔗
The FITS (Flexible Image Transport System) was developed particularly to hold the one, two and three dimensional data that is particular to astronomy, with the requirement for a large amount of metadata to be stored along with an image or table of data. For specific details refer to FITS Data Format.
If a FITS image is loaded into WorldWide Telescope some additional analysis options become available. To load a FITS image simply use the Explore > Open > Image... option, and note that the Scale icon appears in the lower panel alongside the Image Crossfade slider:
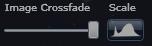
Click on the Scale icon to display a light intensity histogram.

Slide the green and red bars to select the starting and ending points for the display, then select from Linear , Log , Power , Square Root to determine how the data is to be displayed in the main view. Note that the red bar can precede the green bar to invert the slope. The bars limit the range of data that is to be displayed, and the slope determines the emphasis given to the data. The final option, Histogram Equalization , does not use the bars, but instead gives equal emphasis to each intensity level of the data.
Note that there are 256 intensity levels, from pure black on the left margin of the histogram, to pure white on the right. The height of any bar in the histogram indicates the number of pixels in the image at that particular intensity level.
The zoom in and zoom out options enable greater focus on a particular band of data.
Using this tool particular light sources can be examined in isolation.
Sky Surveys🔗
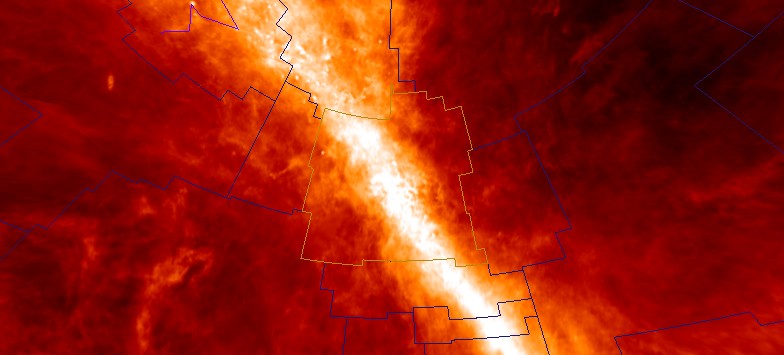
Comprehensive surveys of the sky have been carried out at different wavelengths to help determine the composition of stars and galaxies. The digital images generated by sky surveys are compiled into the data sets that are available in the Imagery drop down list, and usually provide the background image to the view.
Each imagery set provides unique information about objects in the sky because the images were taken at different wavelengths of the electromagnetic spectrum, and at different times. Different wavelengths expose different energy regimes, stellar processes, and effects. For example, with observations made in the low-energy spectrum (radio and microwave), cold processes are exposed: molecules forming or moving about, or giant clouds of gas and dust. The optical band (between infrared and ultra violet) exposes gas escaping from black holes, volcanoes on the moons of Jupiter, or heat escaping from stellar dust. With x-rays, hot processes become apparent such as explosions on stars, neutron stars, comets, supernova remnants, or energy beams emanating from matter falling into black holes. With gamma-rays, even more violent events become apparent, such as the destruction of atoms, stars spiraling into black holes, supernovas, and pulsars.
Electromagnetic radiation is classified as follows:
| Wavelength | Name | | :-- | | Greater than 10cm | Radio waves | | Between 10cm and 1mm | Microwaves | | Between 1mm and 700nm | Infrared radiation | | Between 700nm and 400nm | Visible light | | Between 400nm and 10nm | Ultraviolet radiation | | Between 10nm and 1/100nm | X-rays | | Less than 1/100nm | Gamma rays |
Try selecting a specific object or an area of the sky and then changing Imagery to compare the object's properties. Astronomers have used the different wavelengths to great effect, for example by using the hydrogen alpha wavelength to track stellar red-shift, over 250 planets have been discovered.
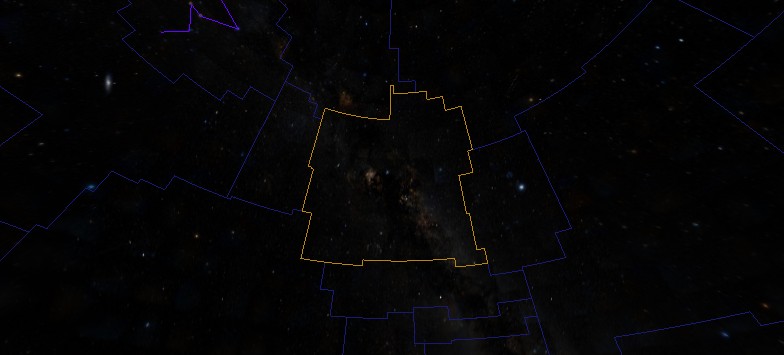
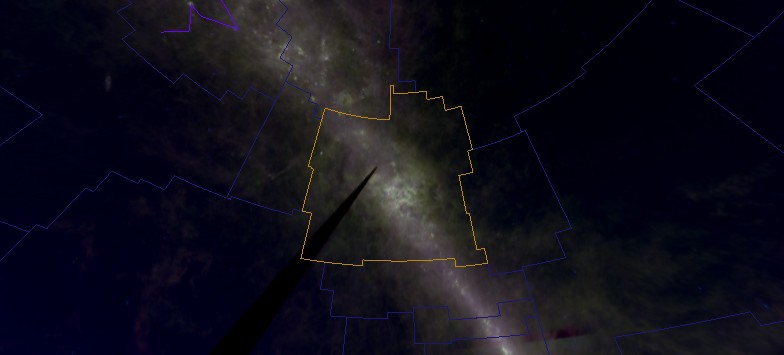
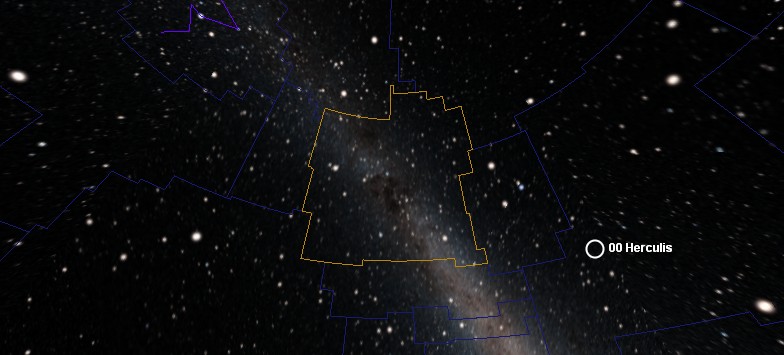
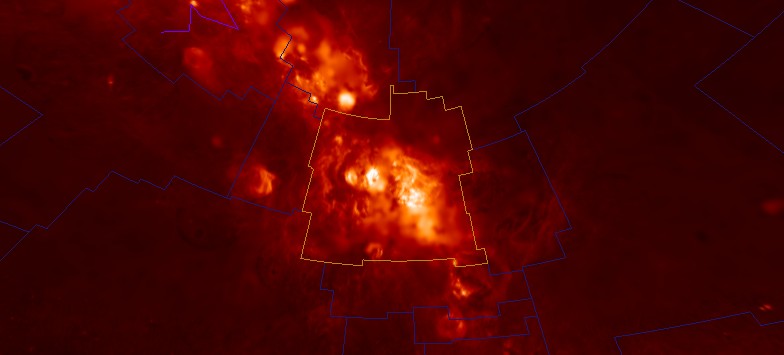
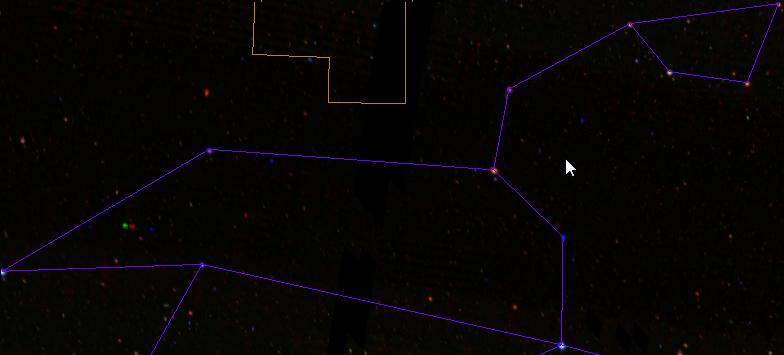
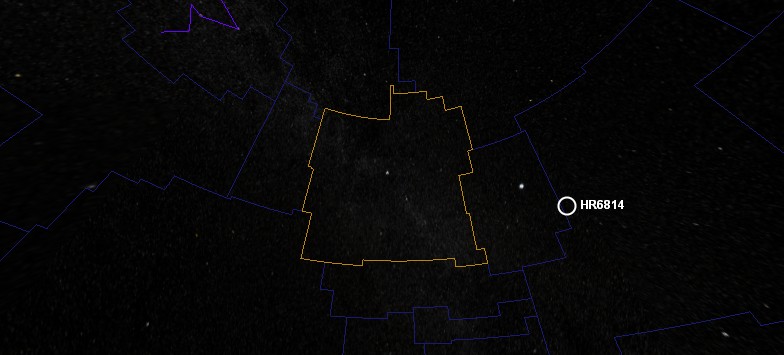
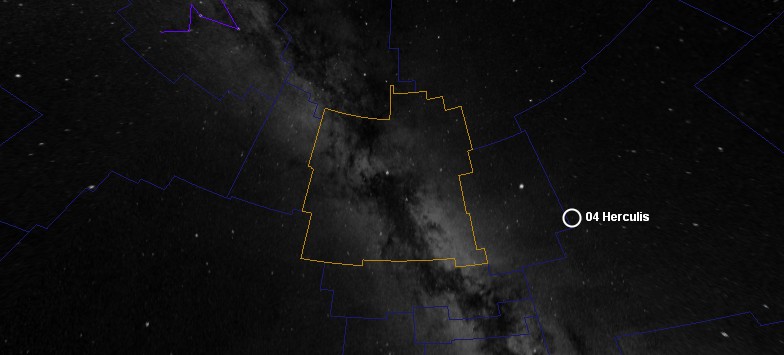
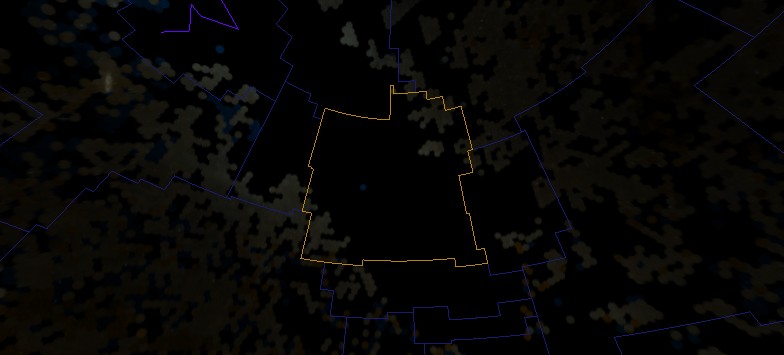
Below is a description of the Imagery sets included in WorldWide Telescope. Note that specific objects are not always visible in every imagery set. For example, specific stars identifiable in the Digital Sky Survey are not always visible to the unaided eye in the Hydrogen Alpha imagery. Also, the different surveys have been carried out at different resolutions. For comparison purposes, the images below show the constellation Cygnus.
Imagery Data🔗
Digitized Sky Survey🔗
A comprehensive sky survey in the visible wavelength, first published in 1994. This survey was created by the Space Telescope Science Institute's (STScI) Catalogs and Surveys Group from images of the northern sky taken by the National Geographic Palomar Observatory in California (from 1948 to 1958) and images of the southern sky taken by the UK Schmidt telescope in Australia (from 1973 to 1988). The original image data was a large number of glass photographic plates, with each plate covering 6.5 x 6.5 degrees of the sky. These plates have produced very large digital images (14000x14000 or 23040x 23040 pixels), and it is a compressed version of these images that WorldWide Telescope accesses.
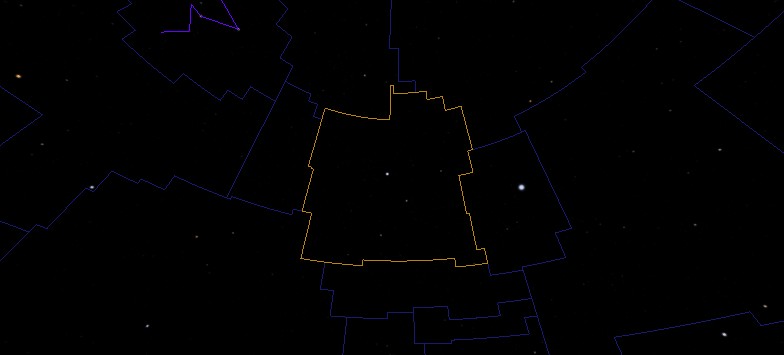
Hipparcos Catalog🔗
Hipparcos is the name of a European Space Agency Mission and Satellite that took images from 1989 to 1993 and accurately catalogued 118,218 stars. Taken from space, the measurements avoided the gravitational, atmospheric and thermal distortions that were limiting ground based telescopes. The error in the positioning of stars in this catalog is under 0.001 arc seconds. An auxiliary star mapper pinpointed many more stars with lesser but still considerable accuracy at 0.03 arc seconds. Known as the [Tycho Catalog](#tycho-Synthetic- optical) this identified 1,058,332 stars.
VLSS: VLA Low Frequency Sky Survey (Radio)🔗
The Very Large Array (VLA) Low-Frequency Sky Survey (VLSS) is an ongoing survey of the sky for radio waves at 74 MHz (4-meter wavelength). The radio survey consists of 358 overlapping images covering the entire sky north of the -30° declination. The survey has so far identified over 70,000 sources of radio waves. From the survey, there are significant samples of objects including high red-shift radio galaxies, galaxy clusters and supernova remnants. Very distant radio galaxies may reveal information on the timeline of cosmic events, such as how soon black holes were formed in the history of the Universe.
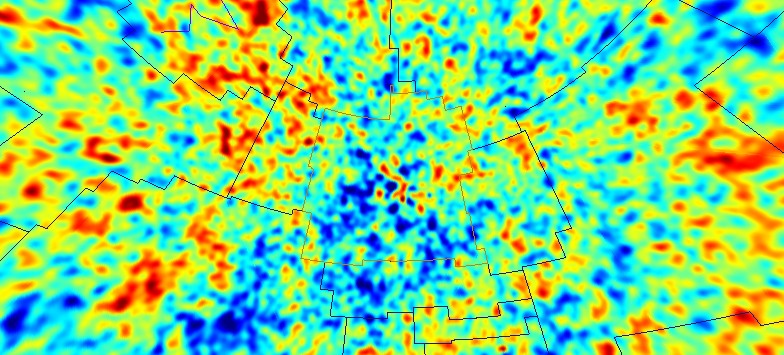
WMAP ILC 5-Year Cosmic Microwave Background🔗
The Wilkinson Microwave Anisotropy Probe (WMAP) was a three-year, all-sky survey that concluded in 2006. The survey was conducted at several microwave bands (K, Ka, Q, V and W) to measure and map the cosmic microwave background radiation, measuring both its intensity and by how much it fluctuates. Microwave radiation is the oldest light in the Universe, and from this survey the Universe is estimated at 13.73 billion years old, to a 1% accuracy. Other results of the survey include support for the theory that most of the Universe is made up of dark energy (73%), with the rest mostly dark matter (22%) and only a small portion (5%) as atomic.
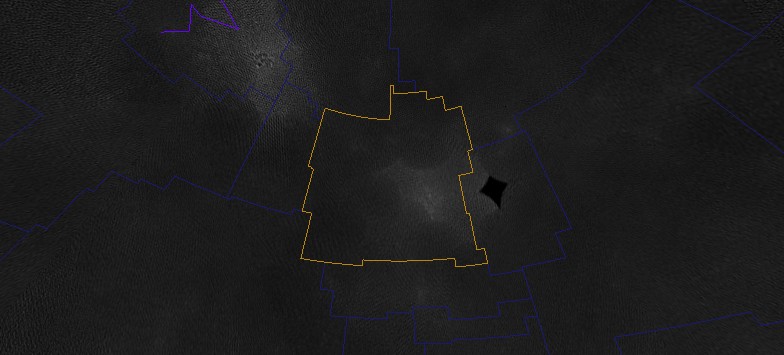
SFD Dust Map🔗
The Infrared Dust Map is an all-sky, 100 micron, far infrared (12, 20, 25, and 100 micron pass bands) survey modulated by dust temperatures and then calibrated to be dust reddening at various magnitudes. Dust affects optical light by effects known as extinction and reddening. Extinction is the loss of light due to scattering and absorption as it travels through clouds of dust. Because the dust scatters blue light more than red, the color of the light also changes - an effect known as reddening. When astronomers measure distant stars, galaxies, supernovae, or any other light-emitting object, they must correct the color and amount of light they measure for the amount of dust the light has passed through.
IRIS: Improved Imaging of IRAS Survey (Infrared)🔗
Starting in 1983 the Infrared Astronomical Satellite (IRAS) - a joint project of the US, UK, and the Netherlands - performed a survey of 98% of the sky at four wavelengths: 12, 25, 60, and 100 m. IRAS led to numerous scientific discoveries spanning a broad range of astrophysical subjects, from comets to circumstellar disks to interacting galaxies. A new generation of IRAS images, called IRIS, benefits from a better zodiacal light subtraction, an improved calibration and zero level, and from a better de-striping. The data set is used to study the variations of dust properties. Several studies of dust emissions at high galactic latitudes show large variations of dust properties depending on the grain sizes of the dust. Large dust clouds are the birthplaces of stars and planets.
2MASS Two Micron All Sky Survey (Synthetic)🔗
The 470,992,970-source Two Micron All Sky Survey (2MASS) Point Source Catalog was produced by a joint project of the University of Massachusetts and the Infrared Processing and Analysis Center. The entire sky was uniformly scanned in three near-infrared bands to detect and characterize point sources brighter than about 1 mJy (1 milliJanksy) in each band. 2MASS used two highly-automated 1.3-m telescopes, one at Mt. Hopkins, Arizona, and one at Cerro Tololo Inter-American Observatory, Chile. The northern 2MASS facility began routine operations in 1997, and the southern facility in 1998. The primary use of these maps is likely to be as a new estimator of galactic extinction.
Hydrogen Alpha Full Sky Map🔗
A full sky map generated at Princeton University compositing the Virginia Tech Spectral line Survey (VTSS) of the northern skies and the Southern H-Alpha Sky Survey Atlas (SHASSA) produced from images taken by the Cerro Tololo Inter-American Observatory in Chile of the southern skies. The hydrogen-alpha filters block out as much of the hydrogen emission spectrum leaving only a band pass from 0.5 Angstrom to 1 Angstrom deep in the red end of the visible light spectrum. The composite map can be used to provide limits on thermal emissions from ionized gas known to contaminate microwave-background data.
SDSS: Sloan Digital Sky Survey🔗
The Sloan Digital Sky Survey (SDSS) was initiated in 2000 and is ongoing. The survey uses a dedicated 2.5-meter telescope at Apache Point Observatory, New Mexico, equipped with two powerful special-purpose instruments: a 120-megapixel camera images 1.5 square degrees of the sky at a time (about eight times the area of the full moon), and a pair of spectrographs fed by optical fibers measure the spectra of (and hence distance to) more than 600 galaxies and quasars in a single observation. After eight years of operations this survey has obtained deep, multi-color images covering more than a quarter of the sky. The result has enabled the creation of 3-dimensional maps containing more than 930,000 galaxies and 120,000 quasars.
The survey has not yet covered the constellation Cygnus, so the image shows the constellation Leo:
Tycho (Synthetic, Optical)🔗
The Tycho-2 catalog is based on a mix of 1991 space-based data from the European Space Agency's Hipparcos satellite, data from the Tycho 1 catalog, and over 140 other astrometric catalogs. The catalog also included the re-analysis of positional data for the Tycho-1 stars. The celestial co-ordinate data for all the earlier catalogs was corrected to match the J2000 epoch of the Hipparcos catalog. The mix increased the number of stars in the catalog to 2,539,913 of the brightest stars in the Milky Way, of which about 5000 are visible to the naked eye. Components of double stars with separations down to 0.8 arc seconds are included.
USNOB: US Naval Observatory B1.0 (Synthetic, Optical)🔗
The US Naval Obersvatory-B1.0 is a catalog of 1,042,618,261 objects. The data were obtained from scans of 7,435 Schmidt plates taken for the various sky surveys during the last 50 years by the Precision Measuring Machine (PMM) at the US Naval Observatory in Flagstaff, Arizona. The originating plate material includes five complete coverages of the northern sky and four of the southern sky To be included in the catalog, an object must have been detected on two different surveys, to avoid the unreliability of single detections. The [Tycho-2 Catalog](#tycho-Synthetic- optical) is the astrometric reference. The USNO-B1.0 is believed to provide all-sky coverage, completeness down to 0.2 arc second astrometric accuracy at J2000, 0.3 magnitude photometric accuracy in up to five colors, and 85% accuracy for distinguishing stars from non-stellar objects.
GALEX (Ultraviolet)🔗
Since its launch in 2003, the Galaxy Evolution Explorer (Galex) telescope has imaged more than a half-billion objects across two-thirds of the sky. The telescope studies galaxies far beyond our Milky Way through its sensitive ultraviolet telescope - the only such far-ultraviolet detector in space. The Galaxy Evolution Explorer has two detectors: one in far-ultraviolet, which reveals stars younger than about 10 million years old, and another in near-ultraviolet, which detects stars younger than about 100 million years old. Massive young stars burn their large supply of hydrogen fuel quickly, burning hot and bright while emitting most of their energy at ultraviolet wavelengths. Compared with low-mass stars like our sun, which live for billions of years, these massive stars never reach old age, having a lifespan as short as a few million years.
RASS: ROSAT All Sky Survey (X-Ray)🔗
The ROSAT All Sky Survey (RASS) was a survey of the sky released in March 2000 by the Max-Planck-Institut f�r extraterrestrische Physik. The survey was the first imaging X-ray survey of the entire sky. Combining the RASS Bright and Faint Source Catalogs yields an average of about three X-ray sources per square degree. However, while X-ray sources are known to range from distant quasars to nearby M dwarfs, the RASS data alone are often insufficient to determine the nature of an X-ray source. The X-rays are mainly emitted by some million-degree gases such as stellar coronae, supernova remnants, superbubbles (a cavity hundreds of lights years across filled with hot gas), and the hot plasma of the galactic nucleus. The faint source catalog has 105,924 sources, and the bright source catalog has 18,811 - the distinction being that to qualify for a bright source listing the source must emit 0.05 counts/sec or greater. Counts per second (or CPS) is a measure of x-ray activity.
Fermi (Gamma)🔗
Launched in 2008, NASA's Fermi Gamma-ray Space Telescope is tasked with exploring extreme environments in the Universe. These include the powerful explosions known as gamma-ray bursts (believed to occur when massive stars run out of nuclear fuel), pulsars (neutron stars emitting beams of radiation), solar flares, and the acceleration of jets of material away from black holes. So far the Fermi telescope has revealed a new class of pulsars, probed gamma-ray bursts and watched flaring jets in galaxies billions of light-years away.
Black Sky Background🔗
Simply sets the entire background to black.
Loading Equirectangular Projection Maps from Local Files🔗
You can also open equirectangular projected images (see the Data Guide) by browsing to their location on your computer. This option works in Planet , Sky and Panorama modes.
Note that there are more surveys available in WorldWide Telescope than are included in the Imagery list. These additional surveys are available in the Collections > All-Sky Surveys > More Surveys collection.
Context Search🔗
The Context Search automatically searches the constellation that the reticle is currently on for deep sky objects that are listed in a catalog, such as the Messier or New General catalogs. If it finds any objects, its thumbnail image is added to the list in the lower panel. As you move the Field of View (FOV) to a new constellation, the thumbnails for the deep sky objects change automatically to reflect all the deep sky objects in the new constellation.
To obtain some information on the items in the Context Search, right-click on the thumbnails in the lower panel and select Properties from the menu. This will display the same information that appears in the The Finder Scope, for example:
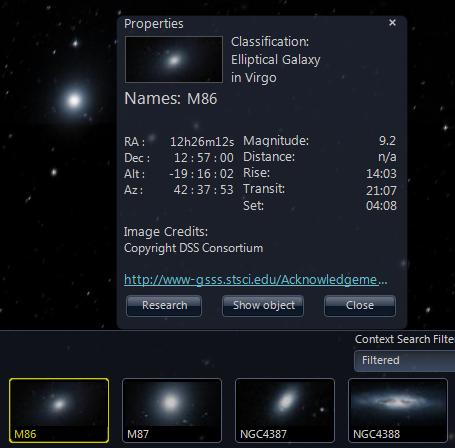
In this example M86 has appeared in the lower panel as a result of the context search. Selecting Properties from the right-click menu displays the property data without changing the view.
Context Search Filter🔗
You can restrict the list of deep sky objects displayed by the Context Search to only those objects identified in the following table, by selecting items in the Context Search Filter .
Click on the thumbnail images below to link to the example. And then click on the thumbnails as they appear in the top panel to bring the objects into view.
| Group | Title | Description | Example |
| :-- |
| Solar System | | The Sun, or any planet or moon of our own Solar System. |  |
| Stellar | Star | A ball of gas held together by its own gravity and emitting its own radiation. |
|
| Stellar | Star | A ball of gas held together by its own gravity and emitting its own radiation. |  |
| | Supernova | A star (at least 8 times more massive than the Sun) that does not have enough fuel for the fusion process in its core will explode due to gravitational collapse. The explosion is called a supernova. The remaining material is known as a supernova remnant. |
|
| | Supernova | A star (at least 8 times more massive than the Sun) that does not have enough fuel for the fusion process in its core will explode due to gravitational collapse. The explosion is called a supernova. The remaining material is known as a supernova remnant. |  Supernova Dust Factory in M74 |
| | Black Hole | A star (at least 10-15 times more massive than the Sun) that became a supernova and then further collapsed in on itself. The infinite density of the supernova's remnants causes the path of light to wrap around it. |
Supernova Dust Factory in M74 |
| | Black Hole | A star (at least 10-15 times more massive than the Sun) that became a supernova and then further collapsed in on itself. The infinite density of the supernova's remnants causes the path of light to wrap around it. |  Black Hole-Powered Jet of Electrons and Sub-Atomic Particles Streams From Center of Galaxy M87 |
| | Neutron Star | The ultra-dense collapsed core of a star that has undergone a supernova. |
Black Hole-Powered Jet of Electrons and Sub-Atomic Particles Streams From Center of Galaxy M87 |
| | Neutron Star | The ultra-dense collapsed core of a star that has undergone a supernova. |  NASA Great Space Observatories Glimpse Faint Afterglow of Nearby Stellar Explosion |
| | Double Star | Two stars that orbit around a common center of mass. |
NASA Great Space Observatories Glimpse Faint Afterglow of Nearby Stellar Explosion |
| | Double Star | Two stars that orbit around a common center of mass. |  |
| | Multiple Stars | More than two stars that orbit around a common center of mass. |
|
| | Multiple Stars | More than two stars that orbit around a common center of mass. |  |
| Stellar Grouping | Constellation | A grouping of stars occupying one of the 88 areas in which the sky is divided. Note that the search filter will locate only those items that have a Constellation classification set on them, which does not include all the constellations themselves, but studies relating to a constellation. |
|
| Stellar Grouping | Constellation | A grouping of stars occupying one of the 88 areas in which the sky is divided. Note that the search filter will locate only those items that have a Constellation classification set on them, which does not include all the constellations themselves, but studies relating to a constellation. |  Young and Old Stars Found in Andromeda's Halo |
| | Asterism | A group of stars that comprise a portion of a larger constellation whether physically related to it or not. For example, the Big Dipper is part of the Great Bear constellation, and the Belt of Orion is part of the Orion constellation. |
Young and Old Stars Found in Andromeda's Halo |
| | Asterism | A group of stars that comprise a portion of a larger constellation whether physically related to it or not. For example, the Big Dipper is part of the Great Bear constellation, and the Belt of Orion is part of the Orion constellation. | 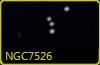 |
| | Open Cluster | A physically related groups of stars formed from the same giant molecular cloud and held together by mutual gravitational attraction. |
|
| | Open Cluster | A physically related groups of stars formed from the same giant molecular cloud and held together by mutual gravitational attraction. | 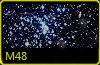 |
| | Globular Cluster | A spherical collection of stars that share a common origin and orbit a galaxy as a satellite. Globular clusters are very tightly gravitationally bound, which gives them their spherical shape. They are also extremely dense towards their core. |
|
| | Globular Cluster | A spherical collection of stars that share a common origin and orbit a galaxy as a satellite. Globular clusters are very tightly gravitationally bound, which gives them their spherical shape. They are also extremely dense towards their core. | 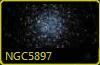 |
| | Nebulous Cluster | A diffuse mass of interstellar dust and gas that orbits a galaxy as a satellite. |
|
| | Nebulous Cluster | A diffuse mass of interstellar dust and gas that orbits a galaxy as a satellite. | 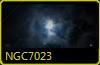 |
| | Dark Nebula | An interstellar cloud of dust so dense that it obscures or absorbs light coming from stars or nebula behind it. | No current examples |
| | Giant Molecular Cloud | A type of interstellar cloud whose density and size permits the formation of molecules, stars, and planets. |
|
| | Dark Nebula | An interstellar cloud of dust so dense that it obscures or absorbs light coming from stars or nebula behind it. | No current examples |
| | Giant Molecular Cloud | A type of interstellar cloud whose density and size permits the formation of molecules, stars, and planets. |  |
| | Interstellar Dust | Irregularly shaped, stellar material, just a fraction of a micron across, composed of silicates, carbon, ice, and/or iron compounds. This material scatters light in our line of sight and obscures or obstructs our view of stellar objects. |
|
| | Interstellar Dust | Irregularly shaped, stellar material, just a fraction of a micron across, composed of silicates, carbon, ice, and/or iron compounds. This material scatters light in our line of sight and obscures or obstructs our view of stellar objects. |  Nearby Dust Clouds in the Milky Way |
| Nebula | Nebula | A diffuse mass of interstellar dust and gas. These areas result from supernova explosions and are the birthplaces of new stars. |
Nearby Dust Clouds in the Milky Way |
| Nebula | Nebula | A diffuse mass of interstellar dust and gas. These areas result from supernova explosions and are the birthplaces of new stars. |  |
| | Planetary Nebula | A shell of gas ejected from stars, such as our Sun, at the end of their lifetimes. This gas continues to expand from the remaining white dwarf. |
|
| | Planetary Nebula | A shell of gas ejected from stars, such as our Sun, at the end of their lifetimes. This gas continues to expand from the remaining white dwarf. |  |
| | Supernova Remnant | The remains of the explosion of a massive star such as a red supergiant. |
|
| | Supernova Remnant | The remains of the explosion of a massive star such as a red supergiant. |  |
| | Emission Nebula | A nebula that shines by emitting light on a hydrogen cloud. |
|
| | Emission Nebula | A nebula that shines by emitting light on a hydrogen cloud. |  |
| | Reflection Nebula | A nebula that shines by reflecting light from nearby stars. |
|
| | Reflection Nebula | A nebula that shines by reflecting light from nearby stars. |  |
| Galactic | Cluster of Galaxies | A group of galaxies that are gravitationally bound together. |
|
| Galactic | Cluster of Galaxies | A group of galaxies that are gravitationally bound together. |  |
| | Quasar | An extremely bright object at the edge of our universe that emits massive amounts of radiation, including radio waves and x-rays. | No current examples |
| | Galaxy | A cluster of stars, dust, and gas held together by gravity. |
|
| | Quasar | An extremely bright object at the edge of our universe that emits massive amounts of radiation, including radio waves and x-rays. | No current examples |
| | Galaxy | A cluster of stars, dust, and gas held together by gravity. | 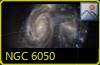 |
| | Spiral Galaxy | A galaxy in which most of the stars are arranged in a disk and have spiral structures ("arms") that extend from the central bulge of stars. |
|
| | Spiral Galaxy | A galaxy in which most of the stars are arranged in a disk and have spiral structures ("arms") that extend from the central bulge of stars. |  |
| | Irregular Galaxy | A galaxy that does not fall into one of the three main Hubble sequence galaxy classes. |
|
| | Irregular Galaxy | A galaxy that does not fall into one of the three main Hubble sequence galaxy classes. | 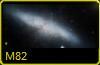 |
| | Elliptical Galaxy | A galaxy that does not have a disk but rather a smooth, featureless profile. They range in shape from nearly spherical to highly flattened. |
|
| | Elliptical Galaxy | A galaxy that does not have a disk but rather a smooth, featureless profile. They range in shape from nearly spherical to highly flattened. |  |
| | Knot | An area within a galaxy containing a greater concentration of material (such as gas, dust, or stars) than adjacent areas. Knots appear in images as bright areas within a galaxy. |
|
| | Knot | An area within a galaxy containing a greater concentration of material (such as gas, dust, or stars) than adjacent areas. Knots appear in images as bright areas within a galaxy. | 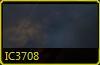 |
| Other | Unidentified | Deep sky objects that have not been identified or cataloged. |
|
| Other | Unidentified | Deep sky objects that have not been identified or cataloged. | 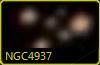 |
| | Plate Defect | Plate defects are images containing photographic errors, such as the reflection of the telescope, color aberrations, dust, and so on. The telescope is usually reflected in an image when a single, very bright object is photographed. |
|
| | Plate Defect | Plate defects are images containing photographic errors, such as the reflection of the telescope, color aberrations, dust, and so on. The telescope is usually reflected in an image when a single, very bright object is photographed. | 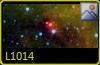 |
| | Other NGC | The New General Catalogue is one of the most commonly-used catalogs in amateur astronomy and contains nearly 8,000 objects. |
|
| | Other NGC | The New General Catalogue is one of the most commonly-used catalogs in amateur astronomy and contains nearly 8,000 objects. | 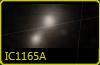 |
|
Stellar Brightness🔗
The value in comparing and cataloging the brightness of stars was apparent to the ancient Greeks, who developed a system of six magnitudes, the brightest being level one, the dimmest level six. The difference between each level was roughly twice-as-dim, so a level six star would be 32 times as dim as a level one star. This system was formalized much later so that a level six star was 100 times as dim as a level one star, so the difference between each level became 2.512. As the Sun, Moon and Planets were not part of the system to introduce them meant adding negative numbers, and to introduce stars that are only visible through telescopes the scale was extended far beyond six, and now goes from -26.73 for the Sun, to about 30 for the dimmest stars visible using the Hubble Space Telescope. It is an odd scale as it straddles zero, but the only important information in it is the difference between two numbers when calculating relative brightness - individual numbers on their own have little meaning. The reference point (a magnitude of zero) has changed from the star Polaris, to Vega, to no star in particular as all stars vary a little in brightness.
The value in this logarithmic scale is that it keeps the numbers in a small range. If the brightness scale was linear and not logarithmic it would have to extend from zero to one trillion simply to include distant stars (and ignoring the brightness of any object in the Solar System). The following image shows the brightness of a number of stars around Canopus (the second brightest distant star in our night sky):
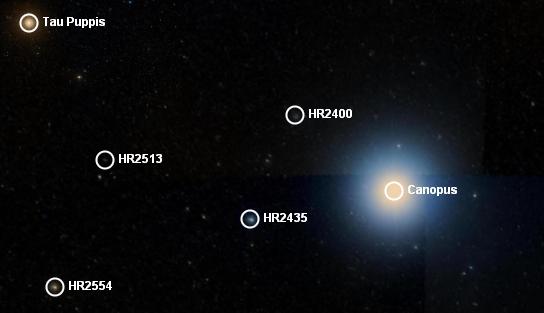
| Star | Magnitude | | :-- | | τ Puppis | 2.93 | | HR2400 | 5.6 | | HR2513 | 6.57 | | Canopus | -0.72 | | HR2435 | 4.39 | | HR2554 | 4.4 |
The brightness magnitude usually quoted for a star is the apparent magnitude, which is how bright it appears to us on Earth. The absolute magnitude of an object is how bright it would appear at a standard distance away from the observer (a distance which has been fixed at 10 parsecs or 32,616 light years). Both figures are often quoted in catalogs of stars, the Finder Scope quotes only the apparent magnitude. Apparent magnitude is often referenced as the letter V, absolute magnitude as the letters MV.
| First object | Second object | Relative Magnitude (V scale) | Relative Magnitude (linear) | | :-- | | Sirius (-1.46) | Canopus (-0.72) | 0.77 | 1.977 | | Spica (1.04) | HR5597 (6.37) | 5.29 | 135.552 | | Canopus (-0.72) | HR2513 (6.57) | 7.29 | 1600.137 | | Alpha Centauri (-0.01) | Proxima Centauri (11.05) | 11.06 | 26559.333 | | Venus (-4.7) | Neptune (7.8) | 12.5 | 100056.530 | | Spica (1.04) | IC3922 (14.8) | 13.76 | 319352.396 | | The Sun (-26.73) | The full moon (-12.6) | 14.13 | 449032.157 | | The Sun (-26.73) | Proxima Centauri (11.05) | 37.78 | 1,296,408,329,574,280.0 |