Earth and Planetary Research
WorldWide Telescope can be used by Earth scientists to study events on our own planet in some detail. The main feature for this purpose is the Layer Manager , which enables layers of data to be rendered on the 3D model of the Earth, where those layers are either static data such as boundaries (political boundaries, watersheds, tectonic plate boundaries, to name a few examples), or dynamic data reporting events on a time line (earthquakes, hurricanes, volcanoes and similar natural events perhaps being the most dramatic, but simple changes in vegetation, sea level, water flow, and so on can also be represented). Static data is usually represented by shape files (lists of vectors defining regions, large and small), and dynamic data is usually represented by spreadsheet data (columns of events, latitude and longitude, times and the magnitude and persistence of the event).
Layers can also be applied to the Sun, the other planets, and some of the moons, in our solar system.
Layers can be added and used as part of Guided Tours.
Time Series Data🔗
Time series data is typically a list of events that occurred at a very specific time (such as earthquakes), or were initiated at a certain time and persist.
To add a layer of time series data, click the Add button on the Layer Manager, or right-click on the node where the data should be added, and select Add from the menu; select the file of data to be added from the Open File dialog. The import of data from an Excel spreadsheet will be made easier if there are column headings in the spreadsheet that are helpful, as WorldWide Telescope uses these to make a best guess as to their purpose. It does not matter if there are more columns in the spreadsheet than are needed - the extraneous columns will be ignored. The spreadsheet should be in .csv or .txt format.
Following the selection of the appropriate file, a series of Data Visualization dialogs will appear that are used to configure the data for WorldWide Telescope:
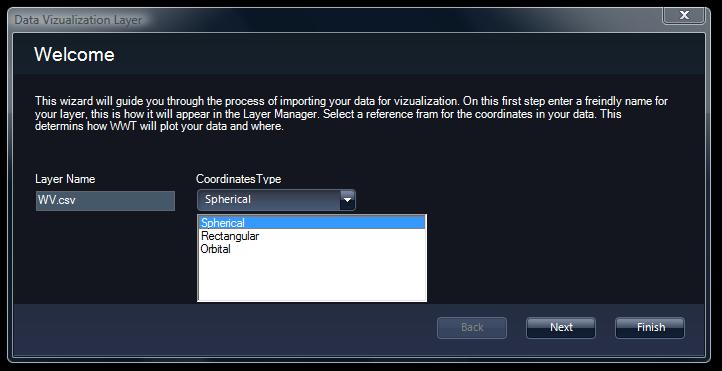
When this dialog appears, first give the data layer a friendly name, and select from the drop down list of coordinate types (often the default of spherical will apply).
Follow the instructions in the dialogs, carefully matching the column headings in the spreadsheet to those requested by the Data Visualization tool.
Setting Time Series Data Running🔗
To set the time series data running, select and highlight the layer in the Layer Manager. Then ensure the Time Series and (optionally) the Auto Loop checkboxes are selected. Then go to the View Menu and accelerate time to see the visualization of the events.