Data Table Layers
In the previous section, we mentioned that if you want to create a lot of annotations, you might be better served by adding a “spreadsheet layer”. In this section, we’ll do just that.
Add the following JavaScript code to your index.html file. (If you’re not
following this tutorial linearly, your baseline consists of the the HTML in A
Basic WWT Window and the JavaScript in
Loading an Image. Changes from this baseline
are subtly highlighted below.)
// ... earlier code omitted ...

function on_wtml_loaded() {
    wwt.setForegroundImageByName("Rho Ophiuchi cloud complex");
    script_interface.setForegroundOpacity(100);
    script_interface.add_arrived(on_arrived);
    wwt.gotoRADecZoom(16.442, -24.385, 1.06, false);
    add_spreadsheet();
}

// ... intervening code omitted ...

const csv_data = `\
ra,dec,size,color\r
246.597,-24.350,1,#FF0000\r
246.679,-24.342,2,#00FF00\r
246.600,-24.413,3,#8888FF\r
`;

function add_spreadsheet() {
    const layer = wwtlib.LayerManager.createSpreadsheetLayer(
        "Sky", // the reference frame for these data
        "My Layer", // a name for the layer
        csv_data // the actual data
    );
    layer.set_lngColumn(0); // the 0'th column stores longitudes (RA)
    layer.set_latColumn(1); // the 1st column stores latitudes (Dec)
    layer.set_sizeColumn(2); // etc.
    layer.set_astronomical(true);
    layer.set_plotType(wwtlib.PlotTypes.circle);
    layer.set_markerScale(wwtlib.MarkerScales.screen);
}

// ... following code omitted ...
</script>
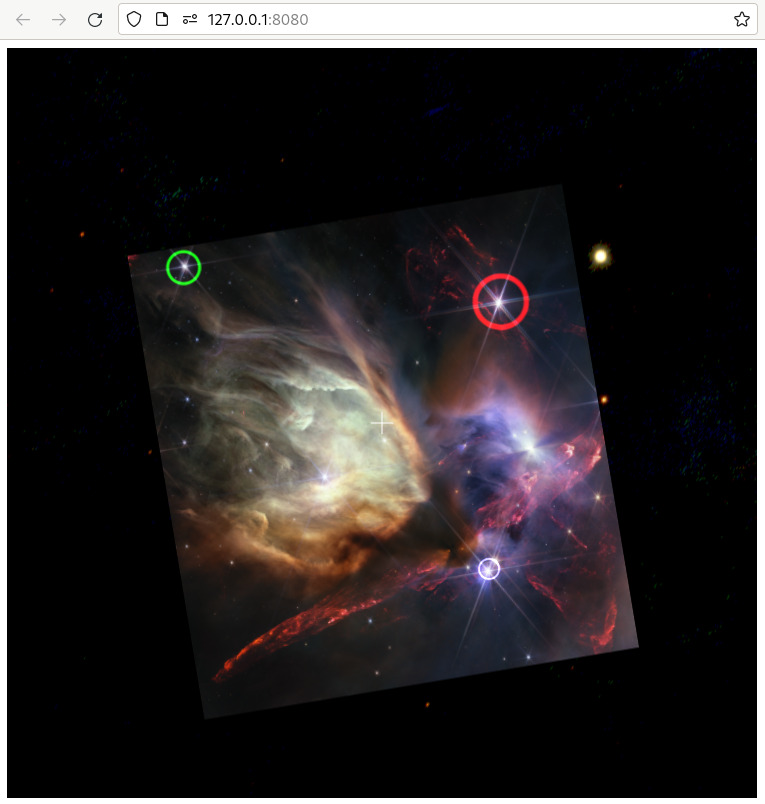
WWT has a powerful engine for rendering data tables, which internally are referred to as SpreadSheetLayers. If you run your app, you’ll see three points with customized positions, symbol sizes, and colors:
As shown in this example, you communicate tabular data to the WWT engine simply
as a big string of CSV data, separated with Windows-style \r\n newlines.
This might seem a bit awkward, but it is easy to assemble such strings, and the
format is fairly efficient. WWT’s WebGL renderer scales such that tables with
tens of thousands of points will generally render with good performance.
In WWT’s tabular data model, you assign different semantics to different columns of your dataset. The call to set_lngColumn() above tells WWT that the 0'th column contains longitudes — or, in a sky context, right ascension values. You might note, however, that this example does not explicitly identify the final column as a “color” column, and yet WWT is rendering the different points with colors corresponding to the column values. This is because WWT contains logic to guess column semantics based on their names.
This example references a new class namespace: LayerManager. This singleton object manages visual ”layers” that are combined in the WWT view. All layers support certain common operations and attributes. For instance, there is a method Layer.set_opacity() that you can use to make your layer transparent:
function add_spreadsheet() {
    // ... earlier code omitted ...
    layer.set_markerScale(wwtlib.MarkerScales.screen);
    layer.set_opacity(0.5);
}
Note that here, opacity values range between 0 and 1, while the engine’s global “foreground opacity” setting ranges between 0 and 100.
The most important layers are SpreadSheetLayer, VoTableLayer, and ImageSetLayer. The VoTableLayer type is almost identical to SpreadSheetLayer: as you might guess, it adds special-case support for parsing and rendering VOTables. The engine also supports some more specialized layer types, mainly aimed at the 3D solar system mode, but not all of them are exposed in the TypeScript API documentation.
Click-to-Select🔗
The WWT research app provides click-to-select functionality for tabular data layers. It’s worth noting that this support is not (currently) built in to the engine itself. One reason for this is that selection UX design can involve many tradeoffs, often requiring close alignment between the backend and the frontend.
The research app implements its selection scheme by listening for mouse click events and using the findRADecForScreenPoint() API to map those to sky coordinates. The app has access to the same data table as the engine, so it can perform a search to see if a click has occurred sufficiently near one of the points in a table. Region-based selections could be implemented with similar logic, taking into account the geometry of the region of interest.